Analytics - Sales Overview
0.6 min read
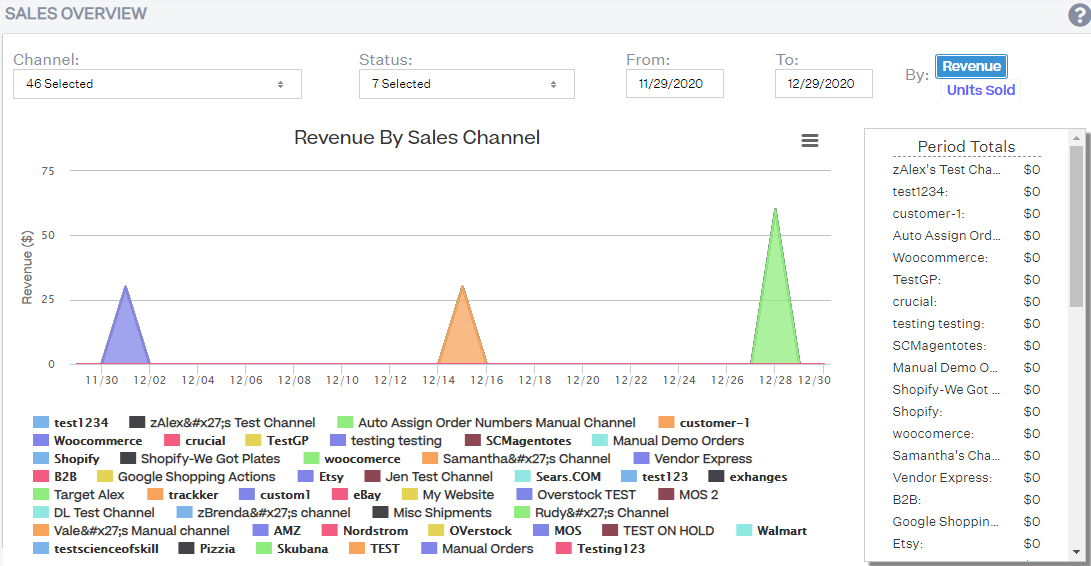
|This report reveals the exact revenue amount each sales channel earns you per day. This graph identifies how your sales channels perform against each other on a daily basis.
How to Read this Report?
You read this report by selecting your time frame and either selecting a few or all of your sales channels to compare against each other. You can read this chart by either revenue earned or the total units sold per day.
The Revenue by Sales Channel graph shows the Total Order Amount Paid for each channel. Moreover, you may view the specific Total Order Amount Paid in the Period Totals section found on the right side of the graph.
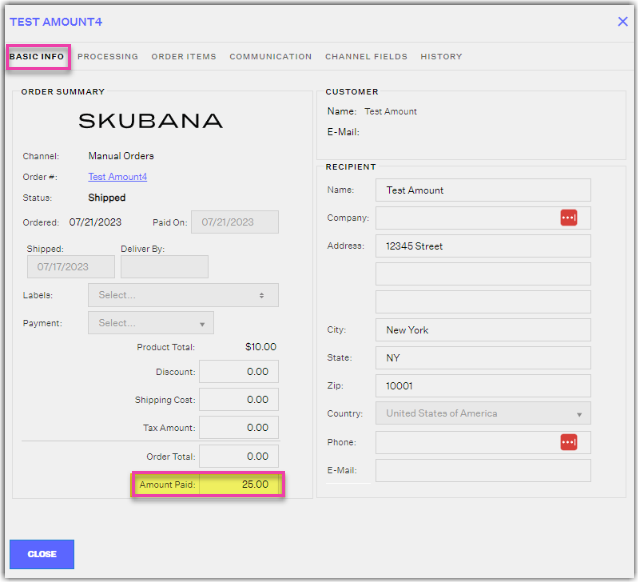
The Total Order Amount Paid comes from all Amount Paid in the Order Summary section.
What Actions to Take After Analyzing this Report?
After you analyze your sales channels’ performance comparison, you can use the overall data to prioritize your sales channel focus. Within seconds, this data provides the information needed to prioritize your inventory allocation, sales trends, and overall performance.
How to Export this Report?
This report is exportable in Microsoft Excel format. For instructions, see Exporting Reports.