Understanding the Inventory Analytics Dashboard
3.9 min read
|This dashboard is currently in open beta.
The Inventory Analytics Dashboard is designed to provide data insights about your inventory aging, value, as well as business KPIs, and critical inventory levels in a fast, interactive experience. The dashboard provides data that has been used in Order Management Analytics and extended analysis and data visualizations. We use more reliable data sources and calculations for visuals like Inventory Aging. This data source may cause discrepancies in data between dashboard visuals and Order Management reports. We will point out these cases throughout the article as they arise.
Accessing the Dashboard
To access the new Inventory dashboard, launch the Analytics application from Extensiv and click on the new Inventory menu option.

Inventory Aging Sheet
The Inventory Analytics Dashboard enables you to view inventory aging by unit quantity and by value. Each measurement method provides a unique perspective on age. Age by unit quantity provides insights into the volume of physical products at various ages based on purchase order receipt dates. Unit quantities have implications for storage, storage costs, product expiration, and changing demand preferences for styles and model years. Age by value provides insights into the amount of capital that is tied up in inventory and the length of time it has been tied off. Aging by value is an important way of measuring the opportunity cost of tying up capital in old inventory at the expense of investing that capital in more fruitful opportunities. Inventory age is also a key indicator for measuring the overall efficiency of your purchasing and inventory management processes.
Overall Age by Quantity
This donut chart visualizes unit quantity by age buckets. You can click any of the visual segments to filter the details table by a specific age bucket.

Overall Aging by Value
This donut chart visualizes overall aging by value by showing a dollar amount associated with all the inventory in an age bucket.

Aging by Warehouse (days or months)
This donut chart shows you the average age of inventory by warehouse. Use the ‘Unit of Measure’ filter in the sheet controls to select ‘Days’ or ‘Months’.

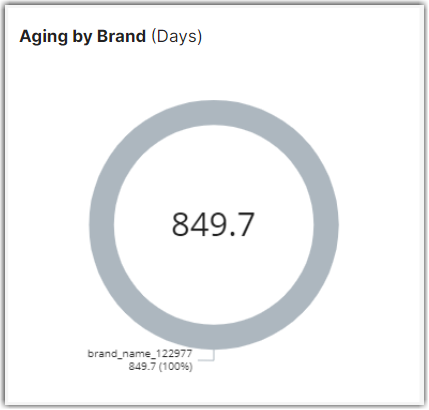
Aging by Brand (days or months)
This donut chart shows you the average age of inventory by brand. Use the ‘Unit of Measure’ filter in the sheet controls to select ‘Days’ or ‘Months’.
Aging Details by Product
This table provides unit quantities and values for each aging bucket for each product. The ‘Average Age’ column’s calculation is affected by two sheet filters. The ‘Unit of Measure’ filter selects ‘Days’ or ‘Months’.

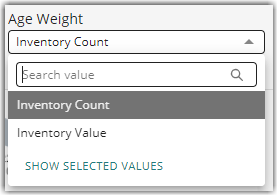
The ‘Age Weight’ filter changes the average age calculation by weight, by age, or by units. Choose the weight option that best fits how you want to measure age.
Inventory Value Sheet
Inventory value is a critical metric for managing a healthy level of investment in inventory and for providing accurate data for financial statements and tax reporting.
How Inventory is Valued in the Dashboard
In the beta phase 2 update, we completed the picture for inventory value by adding the value of inventory outside of the FIFO queue. Now inventory value is based on:
- The value of inventory in the FIFO Queue based on actual purchase order costs
- The value of inventory added manually (not through Purchase Orders) and the value of unreconciled inventory variances, based on default vendor costs for SKUs
While inventory value based on the FIFO queue, including reconciled adjustments, will always be the most accurate method of calculating inventory value, we have added the value of inventory outside of the FIFO queue based on default vendor costs, to give you the most complete picture possible.
Inventory Snapshot Value by Warehouse
This visual shows the snapshot value of all inventory on a specific date. This is a stacked bar chart so that you can see the breakout of inventory value by warehouse. You can also use the filters to select specific brands, warehouses, or products.

Unreconciled Value
These visuals show the total amount of unreconciled value in dollars and the unreconciled quantities by warehouse. These are important indicators to track since any unreconciled amount will impact the accuracy of your value data. The most reliable inventory value data requires that your unreconciled amount for a period is zero.

Snapshot Value Details
This table shows the value detail for the same snapshot date for each brand and product. It shows the full breakdown of quantity and value in the FIFO queue and quantity and value that is unreconciled.

Trending Value by Warehouse
This is a stacked area chart that shows you trending inventory value over a date range, by warehouse. Note that because the new value snapshot data started on July 10th, this visual will not show trending data before then.

KPIs
This sheet provides standard business inventory KPIs to help you assess:
- Inventory Turnover
- Sell-through Rate
- Product Stockouts
Inventory Turnover Ratio
Inventory turnover Ratio is a measure of what percent of your inventory value you are moving in a date range. As the name implies, this KPI measures how much of your inventory you are turning over in a period, based on value. We use the following standard business calculation:
Inventory Turnover Ratio = (Cost of Goods Sold in the Period / Average Inventory Value during the period) X 100.

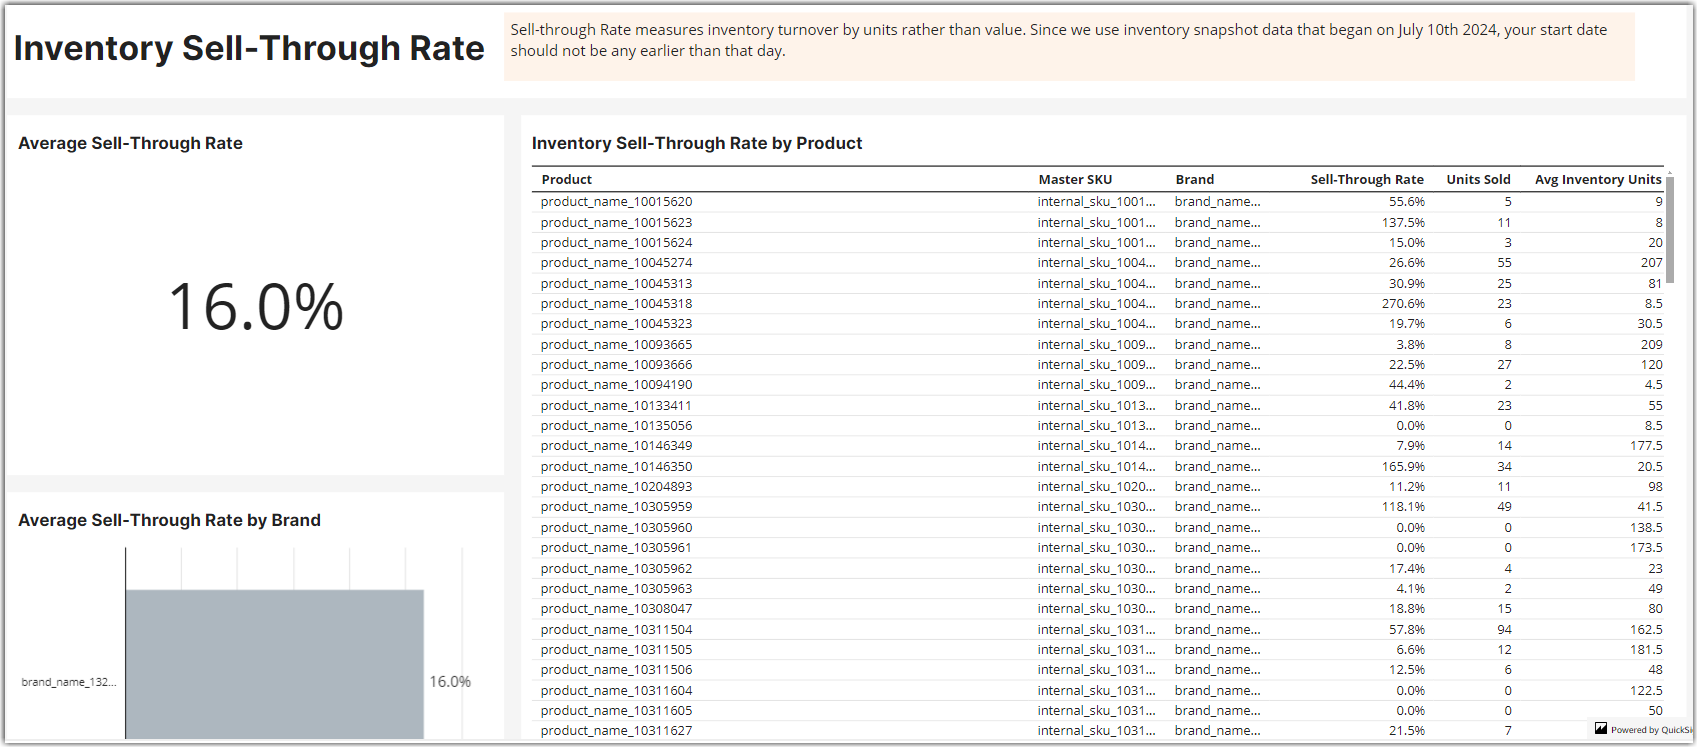
Sell-through Rate
Sell-through Rate is another way to measure turnover except this is calculated by unit turnover instead of value. In the sheet filters, you can choose the measurement method you prefer for measuring sell-through rate – by Inventory Received during a period or Average inventory during that same period. Here is how we calculate it:
By Inventory Received
Sell-through Rate = (Units Sold during a period / Units Received during that period) X 100
By Average Inventory Value
Sell-through Rate = (Units Sold during a period / Avg Inventory Units) X 100
Stockouts
Measuring stockout is important for estimating the opportunity cost of missed orders by not having enough product to fulfill them.
Stockouts are measured in the following ways:
- Days – the total number of days a product was out of stock
- Periods – the number of periods where a product was out of stock, potentially for a number of days
- Duration – the duration of stockout periods or the number of days a product was out of stock in a given stockout period.

Critical Levels
This sheet provides a high-level view of inventory-level KPIs and a detailed analysis of SKUs at critical levels.
Inventory Level KPI
These visuals show the overall days of inventory for all products combined, by brand, and by warehouse.

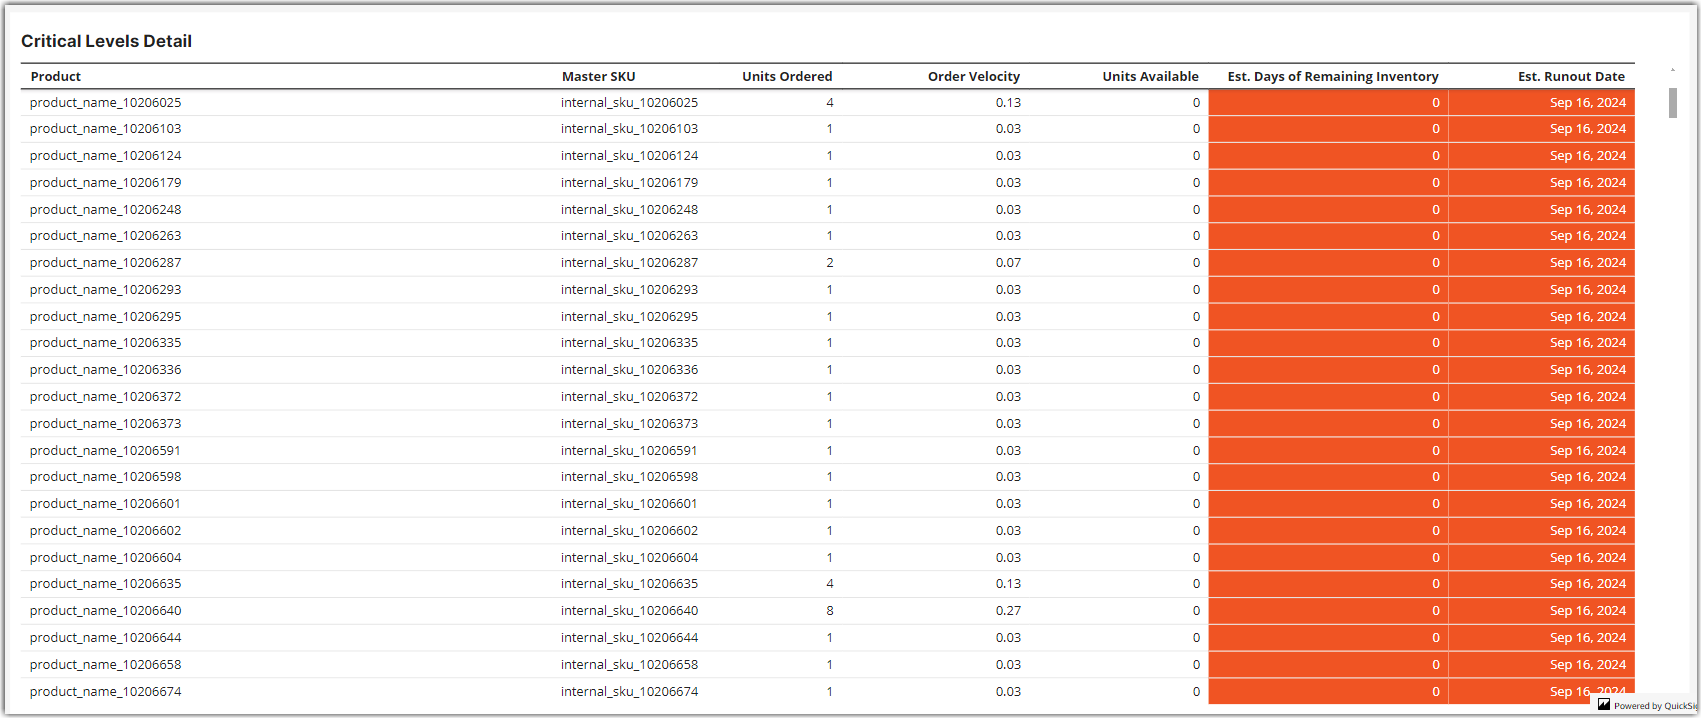
Critical Inventory Levels Detail
This table provides a detailed projection of the days of remaining inventory based on sales velocity. Estimated days remaining and estimated runout date are calculated based on unit order velocity within a date range and current units available. In the sheet controls, you can adjust the velocity date range ("Based on Sales") and set a custom critical threshold level (in days) to highlight items that fall below your threshold.