Analytics - Trending Profitability
1.0 min read
|What does this report reveal?
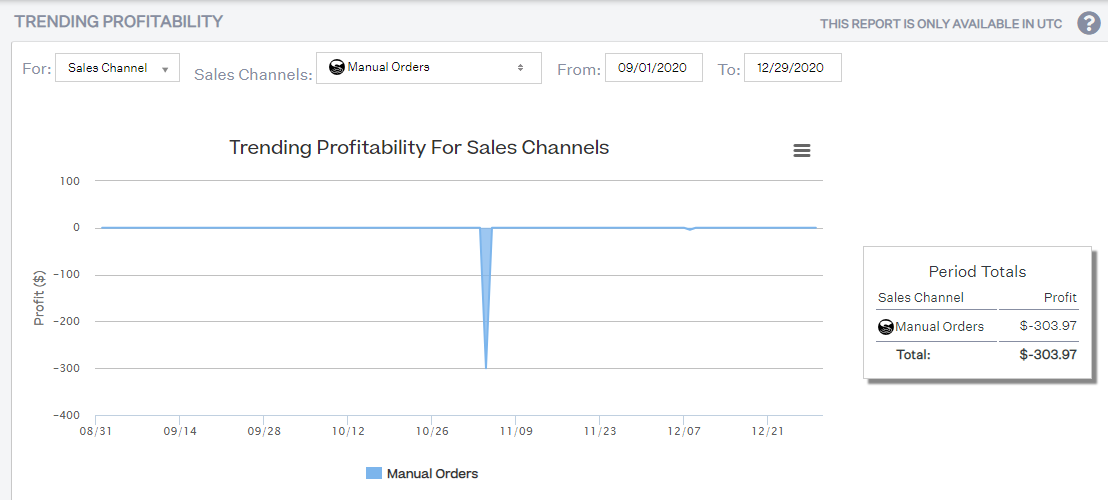
This report reveals trends in the profitability of your company, sales channels, products, and listings over a given date range. Clicking a point anywhere on the chart reveals the profits for the clicked date. It also shows your total profits for the given period.
After generating the profitability reports for your company and sales channels, you can drill down by selecting a specific sales channel or a group of sales channels, a specific product or a group of products, and a listing or a group of listings.
How to read this report?
If you see that your company profitability is going down, you can look more granularly within the sales channel/product/listing profitability reports, find the ones that have not been making any profit, and then look at your trending for the sales channel/product/SKU.
What actions to take after analyzing this report?
After your analysis, you can identify the times when your company is under-performing, predict when these will happen again, and address them through increased marketing efforts, e.g. undergoing promotions and giving discount coupons. You should also plan your marketing spend and allot more money to those sales channels, products and listings that have been performing well over time. For those that are not performing as well, you need to figure out if they are still worth keeping or selling in the long run. You may want to stop selling in an unprofitable sales channel. In cases of unprofitable products/SKUs, you may want to stop selling them altogether.
How can this report be exported:
This report can be downloaded as an image or PDF by clicking on the hamburger menu at the right-hand corner of the graph.


