Analytics - Inventory Value
0.7 min read
|What does this report reveals:
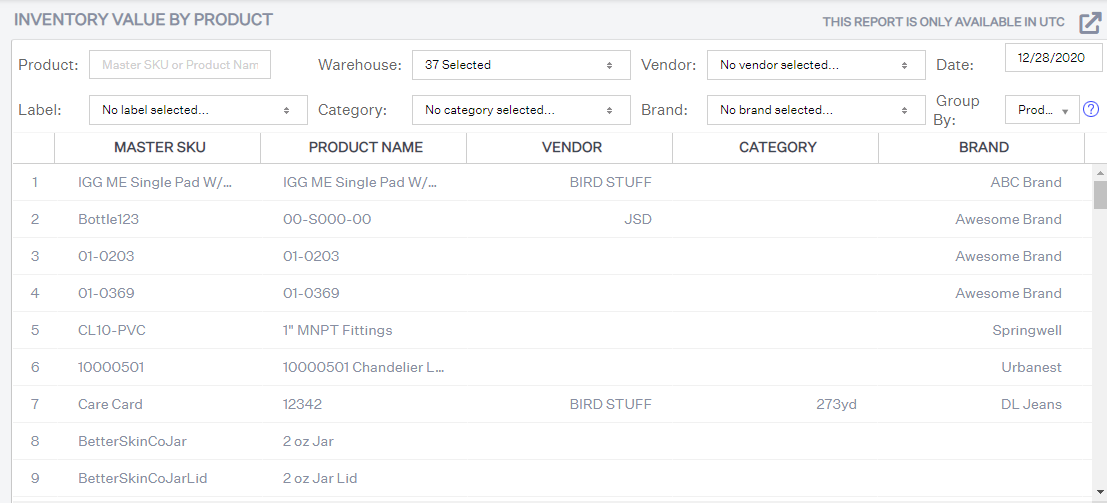
This report reveals the value of inventory in your warehouses on a specified date. This report can be filtered by Warehouse(s), Vendor, Date, Label, Category and Brand

How to read this report:
To read this report, select the warehouse(s) and the date to discover how much product value you have invested into each warehouse and exactly how much your cost of goods sold (COGS) per product is.
The COGS by SKU are for shipped orders. On the other hand, the Inventory Value is for the current inventory, captured at any time of the day; this includes the Transit Unit.
To learn more about the COGS by SKU and Inventory Value, please go to the Where does Extensiv Order Manager determine Inventory Value and COGS from? article.
What actions to take after analyzing this report:
After your analysis, you can use this data with your shipments data to further understand your warehouse performance and, monetarily, how much is inventory value is sitting in your warehouses. Further optimize your warehouses by ensuring your workflows are sufficient to keep moving your inventory values into revenue.
How to export this report:
This report is exportable in Microsoft Excel format. For instructions, see Exporting Reports.
