Understanding the Labor Analytics Dashboard
8.8 min read
|Contact your CSM to enable Labor Analytics for your account.
Improved Time-on-Task Accuracy with Pause and Resume Events
The Labor Analytics incorporates timestamp events from SmartScan and Small Parcel Suite that indicate when a Receiving, Picking, or Packing job was paused or resumed. We then calculated the Time-on-Pause and excluded that time when calculating pace, productivity, and Time-on-Task. Failure to properly pause receiving, pick, and pack jobs will result in inaccurate measurement and poor productivity metrics for that user and for the customer for whom they are doing the work.
Note: Please make sure your team follows these instructions to fully utilize the Pause and Resume events:
SmartScan
- When a user pauses work on a receiving, pick, or pack job, they should exit that pick job in the SmartScan application. This will generate a timestamped Pause Event for that Job.
- When a user re-opens that job, SmartScan will automatically generate a Resume Event for that job.
- Users should not exit the SmartScan app without first exiting the pick job.
- Users should not shut off the mobile scanner before first exiting the pick job.
Small Parcel Suite
- When a user pauses work on a pack job, they should exit the Pack and Ship Screen for that Pack job. This will generate a timestamped pause event for that Job.
- When a user re-opens that job, Small Parcel Suite will automatically generate a Resume Event for that job.
- Users should not exit the Small Parcel Suite app without first exiting the pack job.
- Users should not shut off the computer before first exiting the pick job.
How to access
To access the dashboard, it must be enabled for your account, and you must have the following permission assigned to your user role: Data Insights Module > Operations Dashboards > Labor Analytics.
You can access the Outbound Productivity Dashboard through the left navigation menu via Dashboards > Labor Analytics.
How it works
Data from your 3PL Warehouse Manager database is continually migrated through a data pipeline to an analytical database with the current day’s data. Labor Analytics also includes a second stage of the data pipeline that stores your historical data in an optimized data warehouse. Any of the dashboard visuals that have a “◴” symbol are displaying data that is delayed by 1 hour. All other visuals are for previous days and periods.
Dashboard Navigation and Viewing Tips
- This dashboard contains several charts and tables with vertical scrolling. To scroll down the dashboard, you may need to place the cursor in the space between or on the sides of these visual types.
- You may want to increase or decrease the number of associates displayed in a horizontal bar chart. To do this, drag the handle just below the scroll bar to show more or fewer associates in a horizontal bar chart.
- Expandable filters at the top of each sheet enable you to filter by warehouse, customer, associate, and date or date range To change filter settings, click in the filter area at the top of the dashboard.
- Selecting a warehouse filter on one sheet sets that same value across all sheets
- The warehouse filter dropdown menu will display all live or active warehouses
- There is a Show Help filter that turns dashboard help notes on or off for a sheet.
Clicking the three dots in the upper right of any visual gives you the option to export the data to CSV or Excel for further analysis.
To refresh the dashboard data, you can change any filter (and change it back if needed), close and reload the dashboard, or navigate to a different sheet and return to your original sheet.
Drilling Through to Receiving, Picking, and Packing Details
The are several visuals in the Receiving Productivity, Picking Productivity, Pick Cycle Time, and Packing Productivity sheets that allow you to drill through to the actual picking and packing event details for an associate, including the time stamps for all the events in a pick job or a pack operation. On a horizontal bar chart, right-click on the bar for an associate and choose 'Drill Through to Details'. In the Picking and Packing by Associate Tables, right-click on the associate's name to see the option to drill through to details.
The Labor Analytics Dashboard is currently organized into four sheets or tabs.
- Receiving Productivity
- Picking Productivity
- Pick Cycle Time
- Packing Productivity
- Customer
- Labor Planning
- Results
Receiving Productivity Sheet
Receiving Pace – Today, Yesterday, Last 7 Days, Last 30 Days
These visuals provide an overall productivity perspective for your warehouse or multiple warehouses. Receive Pace is calculated by the number of lines received per hour.

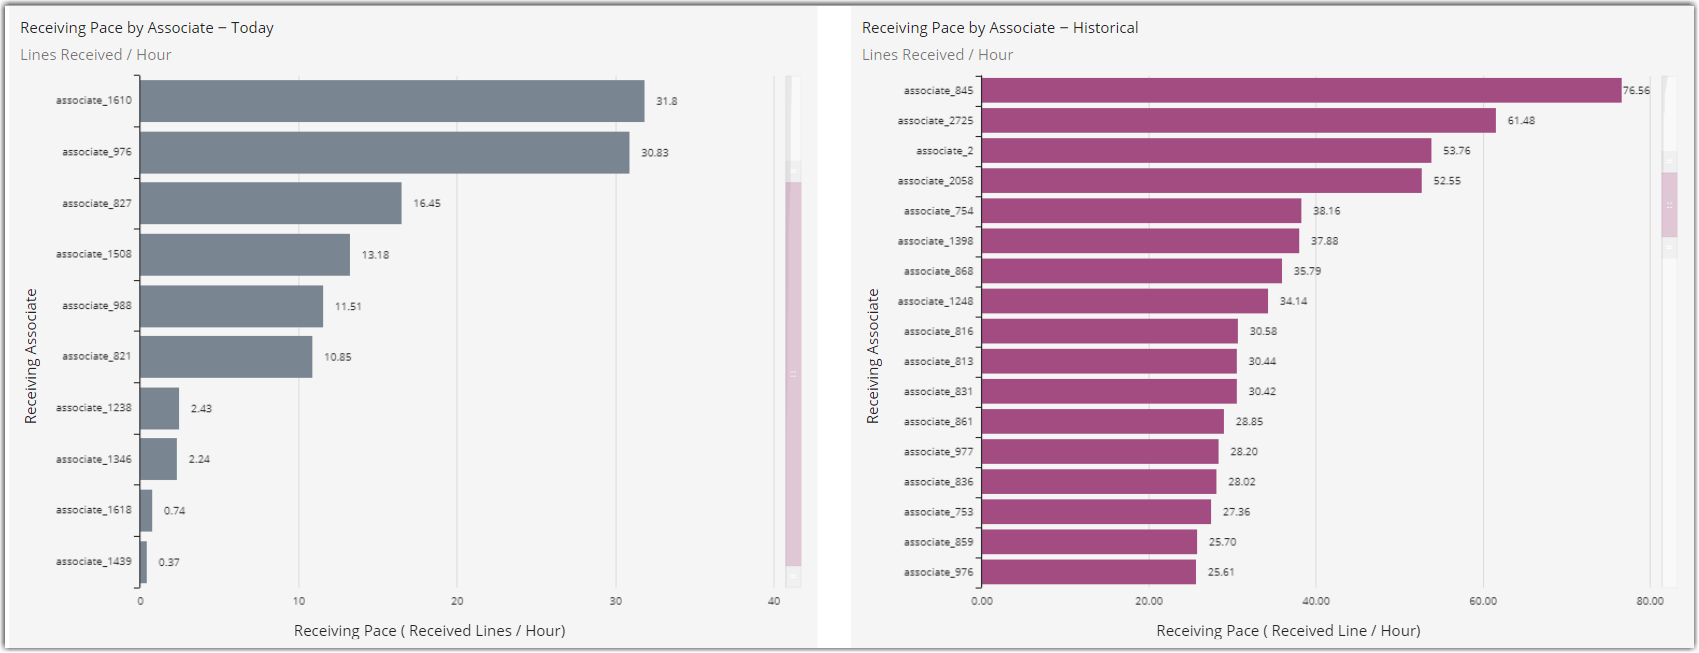
Receiving Pace by Associate – Today and Historical
- The Today Chart shows the current day’s data, the Historical chart is based on the date range set in the sheet filters.
- Pace is measured by Lines Received per hour or minute (based on the unit of measure in the sheet filters settings)
- Right-click on a horizontal bar corresponding to an associate to see their receiving details in the details sheet.
Note: Keep in mind that this chart shows pace regardless of how much work was performed. To see a more complete picture of productivity see the visuals entitled “Associate Receiving Productivity by Pace and Work Volume” or “Receiving Productivity by Associate”
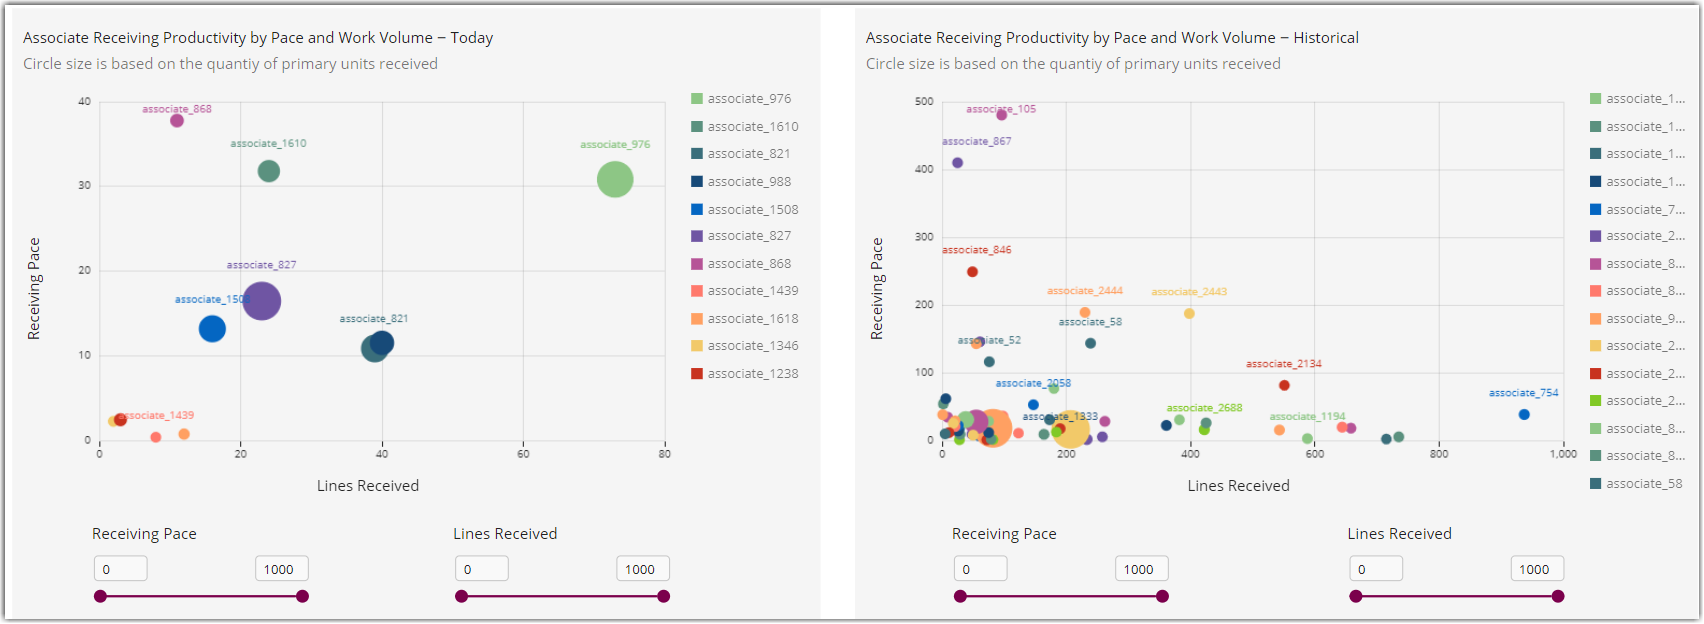
Associate Receiving Productivity by Pace and Work Volume
This Scatter Chart plots associate productivity on 3 dimensions – pace (y axis), number of lines received (x axis), and quantity of primary units received (size of the circle). You can filter the chart by using the slide filters to set minimum and maximums for Receiving Pace and Lines Received.
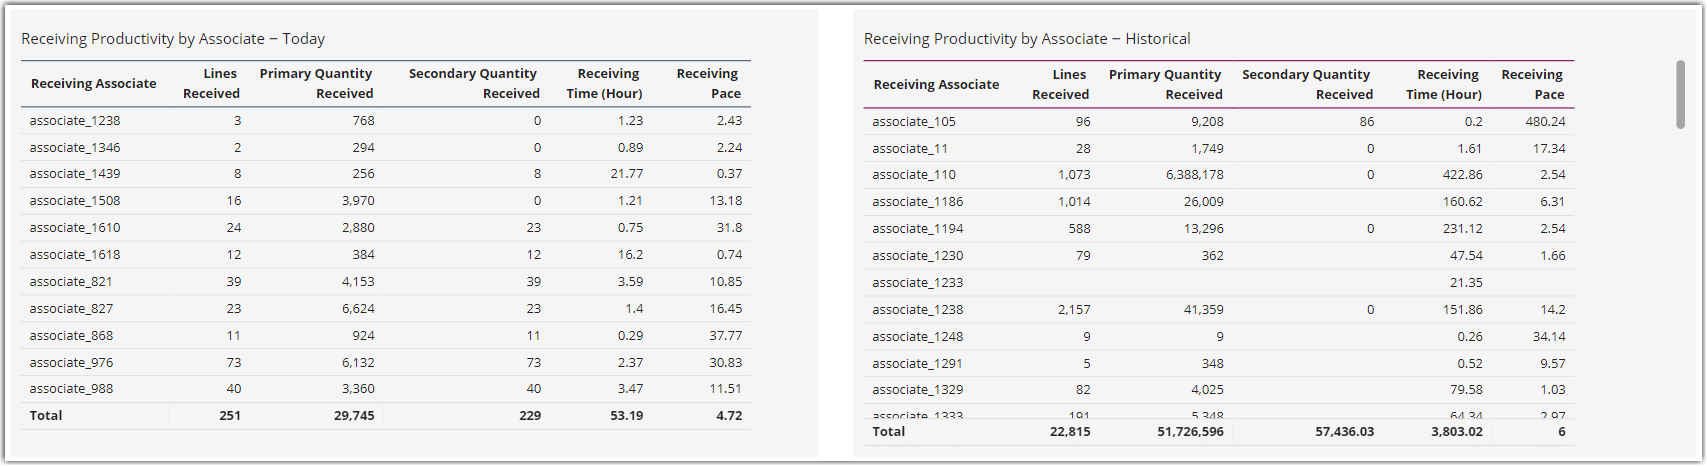
Receiving Productivity by Associate
This table provides the productivity total for each associate. Like any visuals in the dashboard, this table can be exported for further analysis by clicking on the 3-dot menu.
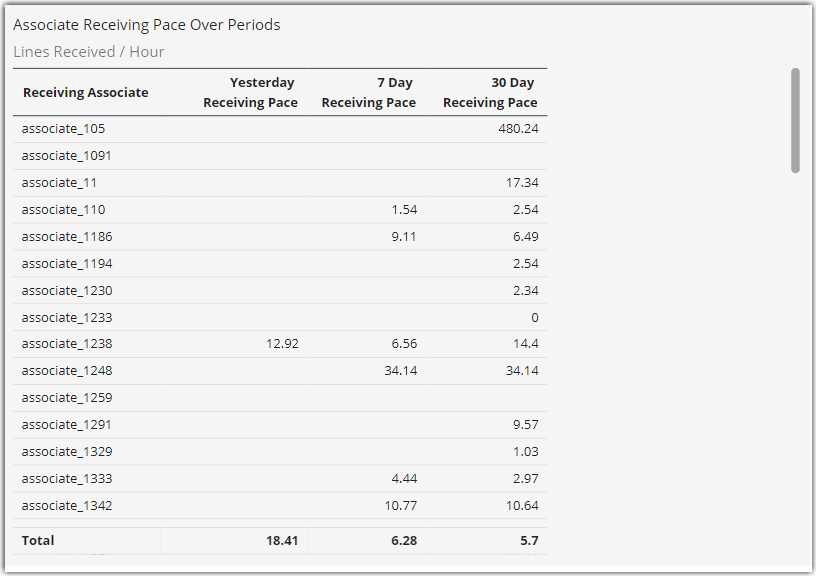
Associate Receiving Pace Over Periods
This table compares the average receiving pace by associate or yesterday, last 7 days, and last 30 days.
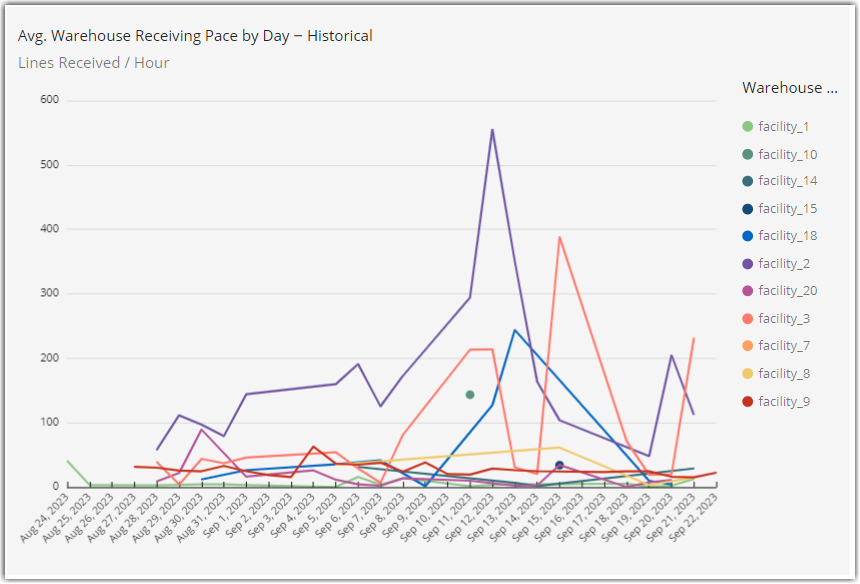
Avg. Warehouse Receiving Pace by Day – Historical
This line chart shows the overall receiving pace by day per warehouse.
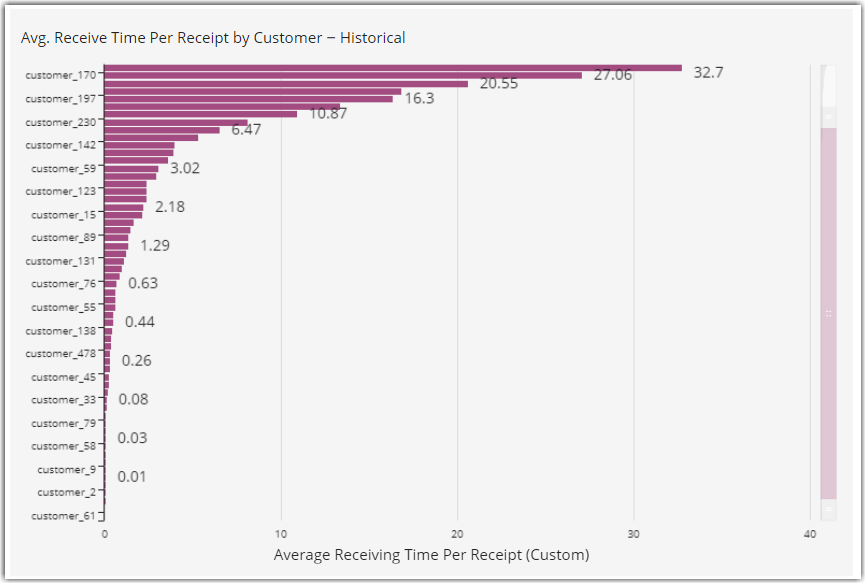
Avg. Receive Time Per Receipt by Customer – Historical
This chart highlights differences in average receipt time for various customers.
Receiving Time Threshold Exceeded
These tables show receipt transactions that exceed the time threshold set in the sheet filters. This can help identify receipts that are stalled or that were not properly paused in SmartScan.
Receiving Time by Customer – Historical
This table shows totals for receiving activity by customer over the selected date range.
Picking Productivity Sheet
This sheet is designed to help you compare overall team picking productivity for today and previous periods with the performance of each individual associate.
Let’s start with the Picking Pace metric. A filter at the top of the page enables you to measure picking pace by Picks or Primary Units Picked. You can choose Hour, Minute, or Second as your Timing Unit of Measure.
The Picking Pace by Associate visuals measure pace regardless of the volume of work done. It is possible to have an associate quickly perform only a few picks but rank at the top of the leader board while those that performed more work rank lower. To mitigate the risk of misinterpreting productivity, we have also included Picking Productivity by Associate Tables that provide all the details about the volume of work done in terms of picks and primary units picked. We have also provided several alternative productivity measurements in the ‘Experiments’ sheet. We will be evaluating these alternative calculations based on your feedback.
Picking Pace by Associate – Today and Historical
You’ll notice that, wherever possible, we compare today’s productivity data alongside data from a historical period. You can configure the date range for the historical visual in the filter at the top of the sheet. If you change the Picking Pace Type filter, it will automatically update the charts.
Picking Productivity by Associate – Today and Historical
These visuals provide the details you need to get a more accurate picture of productivity that combines pace with the volume of work done. You can click on the three dots in the upper right-hand of the visual to export the data from these tables to CSV or Excel.
The Labor Analytics incorporates timestamp events from SmartScan and Small Parcel Suite that indicate when a Receiving, Picking, or Packing job was paused or resumed. We then calculated the Time-on-Pause and excluded that time when calculating pace, productivity, and Time-on-Task. Failure to properly pause receiving, pick, and pack jobs will result in inaccurate measurement and poor productivity metrics for that user and for the customer for whom they are doing the work.
Associate Average Picking Pace
This provides a view of picking pace (as configured in the filter) over the previous day, the last seven days, and the last 30 days.
Average Warehouse Picking Pace by Day
This chart visualizes the picking pace for each warehouse, day by day, over the configured date range.
Jobs with Picks Exceeding Max Pick Time Setting – Today and Historical
These tables list the pick jobs with pick cycle times that exceeded the Max Pick Time Threshold.
Average Picking Efficiency Percentage
This visual calculates overall picking efficiency based on the number of successful picks (picks that were not unpicked) divided by the total number of pick operations (picks and unpicks).
Picking Efficiency Percentage by Associate
This visual calculates picking efficiency by associate, using the same calculation.
Pick Cycle Time Sheet
Pick Cycle Time measures the average time between picks. It is a way of measuring team and individual productivity but also provides a way to measure warehouse layout efficiency.
Important Note: Pick jobs that span multiple days cause long pick cycle times that can impact the Average Pick Cycle Time calculations. To adjust for this, use the 'Max Pick Time Threshold' filter above.
Like the Picking Productivity Sheet, these visuals show:
- Overall averages over periods
- Pick Cycle Time by Associate – Today and Historical
- Associate Ave Pick Cycle Time over periods
- Warehouse Pick Cycle Time by Day (over the configured date range)
Packing Productivity Sheet
Packing pace is measured in Item Packs / Minute. Like the Picking Productivity Sheet, these visuals show Packing Productivity visualized by:
- Overall averages over periods
- Picking Pace by Associate – Today and Historical
- Associate Ave Packing Pace details over periods
- Warehouse Packing Pace by Day (over the configured date range)
- Average Packing Efficiency Percentage
- Packing Efficiency Percentage by Associate
If you are using both SmartScan and Small Parcel Suite for packing, this sheet includes a filter that enables you to select either SmartScan, Small Parcel Suite, or All as a data source for the visuals.
Customer Sheet
The visuals on this sheet will help you estimate fulfillment cost-to-serve by customer so that you can estimate profitability and evaluate your rates.
- Picking and Packing Time-on-Task by Customer
- Customer Avg. Pick Times - Historical. This table provides Avg. Pick Job Time, Avg. Order Line Pick Time, and Avg. Pick Cycle Time. Pick Cycle time is the average time for a single item pick operation.
- Customer Avg. Pack Times - Historical. This table provides Avg. Order Pack Time, Avg. Order Line Pack Time, and Avg. Pack Cycle Time. Pack Cycle Time is the average time for a single-item pack operation.
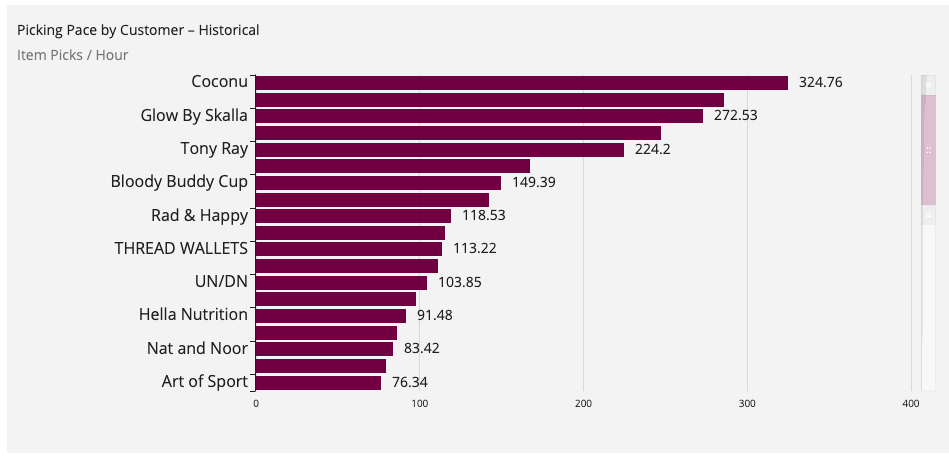
- Picking and Packing Pace by Customer
Inbound
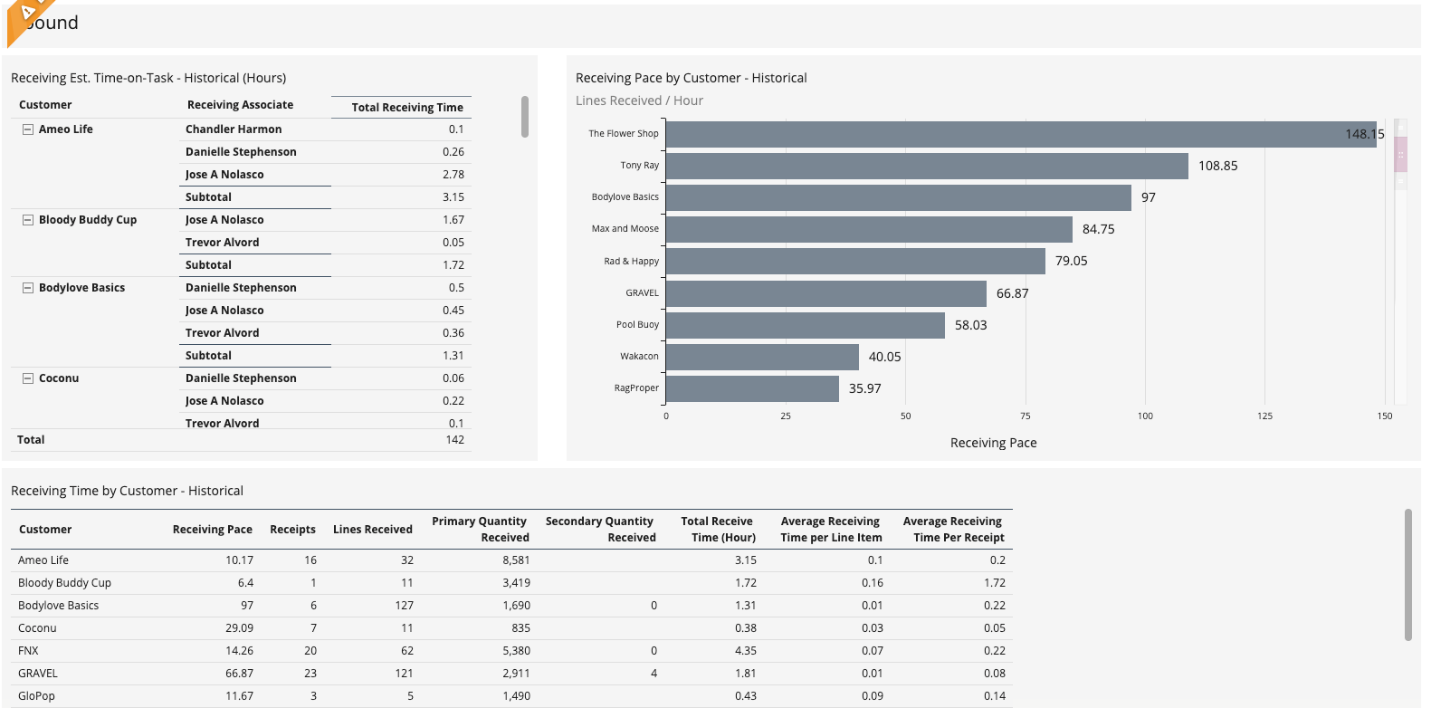
With the addition of Receiving Labor metrics, the Customer Sheet now includes an Inbound section with the following visuals:
- Receiving Est. Time-on-Task – Historical. This pivot table shows the total receiving time-on-task by customer over the selected date range, as a total and broken out by associate.
- Receiving Pace by Customer – Historical is a horizontal bar chart that shows the average pace by customer. Pace is measured by Lines Received / Hour.
- Avg. Receiving Time by Customer – Historical is a table with receiving details by customer and average receiving time per line and average receiving time by receipt.
Outbound
This section now includes horizontal bar charts of Picking Pace by Customer and Packing Pace by Customer.
Labor Planning Sheet
This sheet provides workflow volume metrics from previous days to help you plan labor resource requirements for the future. In addition to warehouse-level metrics, it also provides hour-by-hour metrics by associate for receiving, picking, and packing.
Inbound
With the addition of receiving metrics, this sheet now includes an Inbound section with the following visuals:
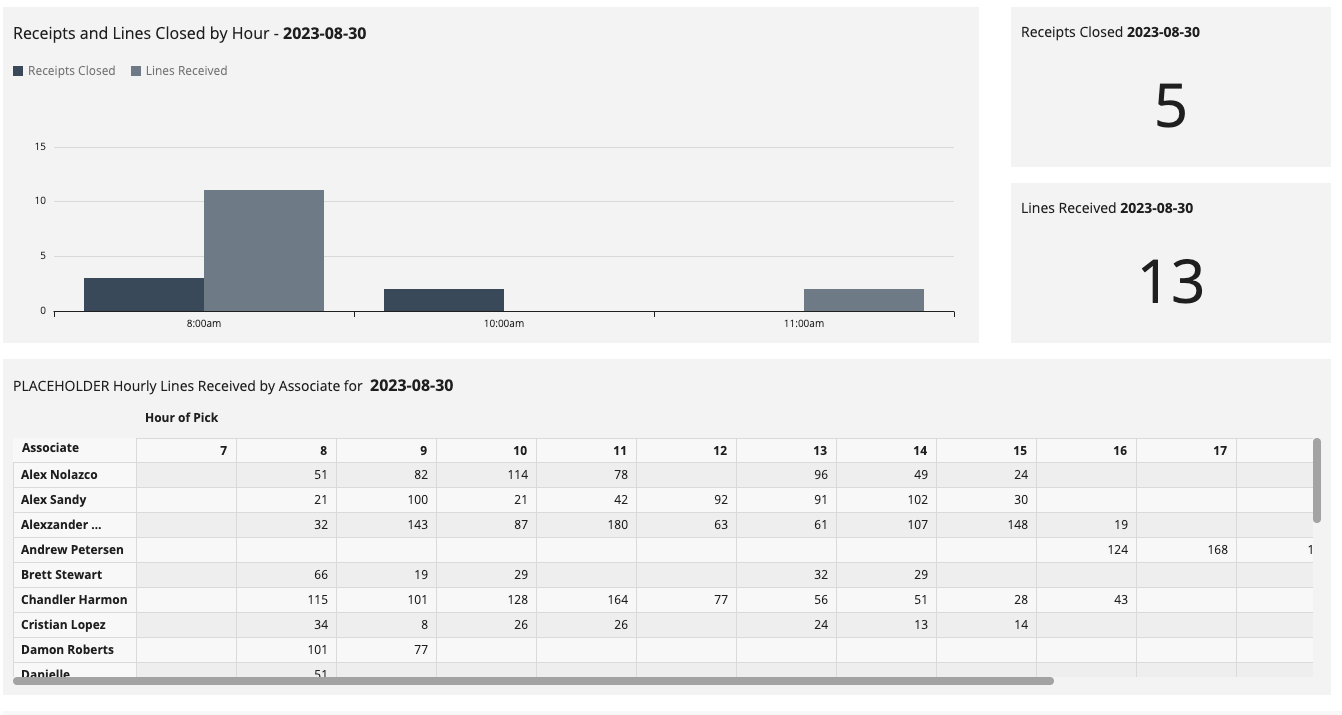
- Receipts and Lines Closed by Hour over a date range. The date range is specified in the sheet filters.
- Receipts and Lines Closed by Hour on a specific day. The date is specified in the sheet filters.
- Receipts and Lines Closed on the current day
- Hourly Lines Received by Associates on a specific day.
Results Sheet
This sheet lets you compare changes in pace and other picking productivity between configurable baseline and comparison periods. Changes in picking productivity performance are tracked by warehouse, associate, and customer. The line chart to the right shows the aggregated performance change for each group but you can click on individual warehouse, associate, or customer names to see individual performance over time.
By default, the comparison period is set to the last 30 days and the baseline period the 30 days prior. In the sheet filters, you can set the baseline and comparison periods to whatever you like.
Details Sheet
This is the sheet that the dashboard jumps to when you right-click on a horizontal bar or an associate's name to Drill Through to Details. There are visuals in detail associated with Pick Jobs Today, Pick Jobs Historical, Pack Jobs Today, and Pack Jobs Historical. Look for the visual that corresponds with the type of data in the visual from which you started. For example, if you right-click on the horizontal bar for an associate in the Picking Productivity - Historical visual, then you would scroll down to Pick Jobs - Historical in the details sheet.
You can also start a search directly from the Details Sheet by opening the filters and entering a Pick Job ID, a Transaction ID, or an Associate.
With the addition of Receiving Labor metrics, the Details Sheet now includes:
- Receipts overview Today and Historical by associate with the following columns:
- Receipt transaction ID, Receipt Start timestamp, Receipt End Timestamp and Elapsed time
- Receipts Details Today and Historical by associate with the following columns:
- Transaction ID, Receipt Line ID, Event, Event Timestamp, Elapsed Time, Item SKU, Item Description, Primary Units
- Transaction ID, Receipt Line ID, Event, Event Timestamp, Elapsed Time, Item SKU, Item Description, Primary Units
- Selecting a warehouse filter on one sheet sets that same value across all sheets
- The warehouse filter dropdown menu will display all live or active warehouses
- Selecting a warehouse filter on one sheet sets that same value across all sheets
- The warehouse filter dropdown menu will display all live or active warehouses
- Selecting a warehouse filter on one sheet sets that same value across all sheets
- The warehouse filter dropdown menu will display all live or active warehouses
- Selecting a warehouse filter on one sheet sets that same value across all sheets
- The warehouse filter dropdown menu will display all live or active warehouses