• Help Center
  • Order Management
  • Analytics
  • Products
  • Analytics
    • General
        • Historical Purchase Orders Export - Analytics
        • The Analytics Module's Landing Page
        • Analytics Reports
        • Printing Charts from Analytics
        • Exporting Reports
    • Products
        • Analytics - SKU Profitability
        • Y-O-Y Growth
        • Understanding Listing Profitability Analytics
        • Understanding Top Sellers & Worst Sellers Reports
        • Analytics - Trending Profitability
    • Dashboard
        • Opportunities Found by Extensiv Order Manager
    • Inventory
        • Analytics - Inventory Replenishment Alerts
        • Analytics - Snapshot Inventory Value
        • Analytics - Trending Inventory Value
        • Analytics - Critical Inventory Levels
        • Analytics - Inventory Aging
    • Customers
        • Analytics - Lifetime Value
        • Analytics - Biggest Spenders
        • Analytics - Most Frequent Customers
        • Analytics - Most Recent Customers
    • Orders
        • Historical Orders Exports - Analytics
        • Analytics - Sales Overview
        • Analytics - Biggest Tickets
        • Analytics - Shipments
    • Accounting
        • Analytics - Shipment Summary
        • Analytics - COGS by SKU
        • Analytics - Sales Summary
        • Analytics - COGS By Sales Channel
        • Analytics - Inventory Value
    • Inventory Analytics Dashboard
        • Understanding the Inventory Analytics Dashboard
        • Inventory Analytics Dashboard FAQs
      • Sales Analytics Dashboard FAQs

Understanding Listing Profitability Analytics

This article explains the analytics reports related to Listing Profitability. 

What does this Report Reveal?

This report reveals your SKU’s performance data by both gross and unit margins and implied shares per sales channel. It also reveals the fees that are taken from you by the sales channel per each sale made. You can see this by clicking on a listing SKU.

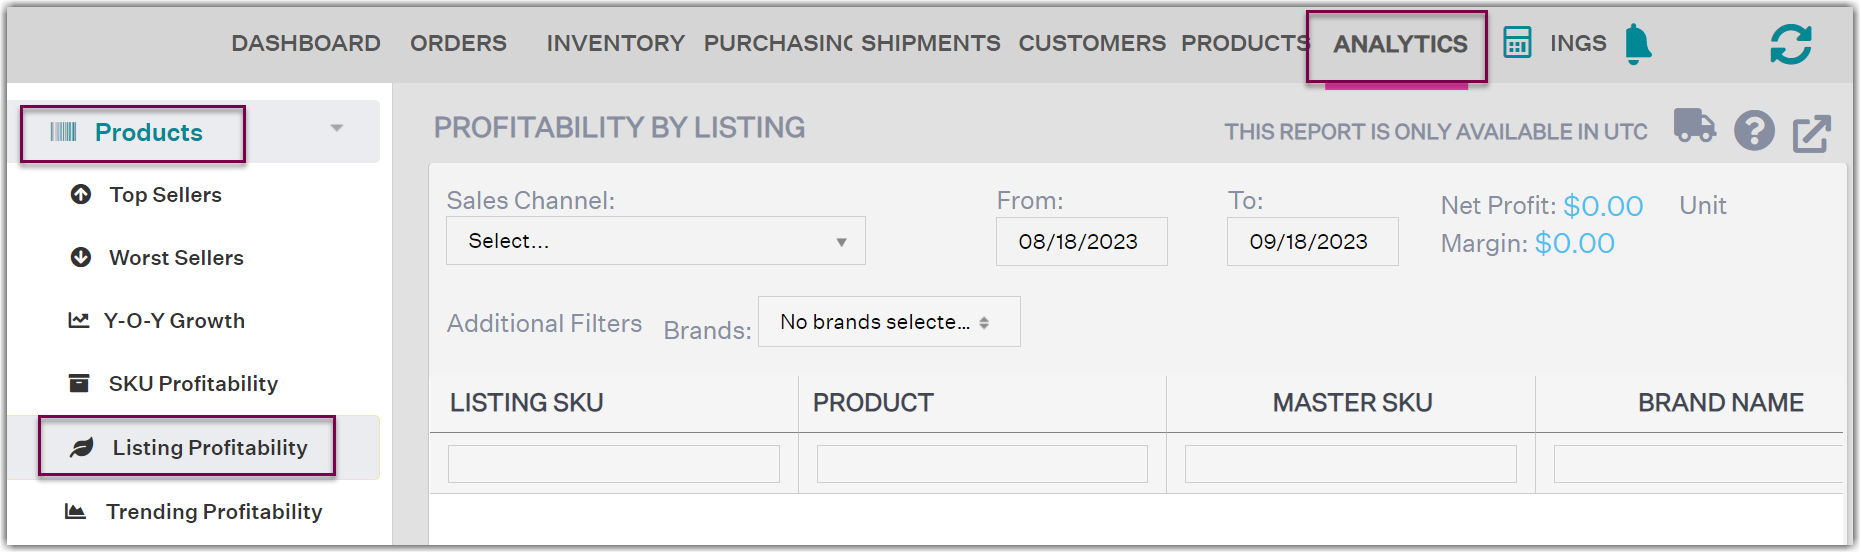
How to Read this Report?

This report provides you with insight on what SKUs are earning the most or weighing you down in each particular sales channel. Implied share gauges how much the SKU contributes to the overall profit margins of your business. Anything above 0 is a positive influence, and anything below is negative.

The Unit Margin is calculated through this equation: Total Margin / Total Quantity Sold.

The Implied Share for Product Listing is calculated through this equation: (Margin/Gross Margin) / (revenue/Gross Revenue).

What Actions to Take After Analyzing this Report?

After your analysis, if you identify a poorly performing sales channel listing, research into its listing profitability and identify the exact SKUs that are under-performing. If its performance is far too weak, you should liquidate the product or reallocate to a more successful channel. However, if it’s performing mediocre, you should optimize your listings to compete better or reprice it entirely.

How to export this report

This report is exportable in Microsoft Excel format. For instructions, see Exporting Reports.


profitability analytics

Was this article helpful?

Yes
No
Share additional feedback about this article

Related Articles

  • How to Enable Extensiv Order Manager to Automatically Calculate Order Weight Based on Product Weight

Not finding the help you need?

Contact Support
Solutions
  • Solutions for Brands
  • Solutions for 3PLs
  • Solutions for 4PLs
  • Solutions for B2B
Products
  • Extensiv 3PL Warehouse Manager
  • Extensiv Warehouse Manager
  • Extensiv Order Manager
  • Extensiv Integration Manager
  • Extensiv Network Manager
Products
  • Customer Success
  • Implementation
  • Consulting
Ecosystem
  • Fulfillment Marketplace
  • Integrations
  • Partners
  • Become a Partner
Resources
  • Resource Library
  • Blog
  • Market Insights
  • What is a 3PL?
  • What is a 4PL?
  • What is a WMS?
  • Why a Cloud-based WMS?
  • Glossary
Help
  • Help Center
  • API Documentation
  • Extensiv Univerisity
  • Community
  • System Status
  • Extensiv Logo
  • 100 N Pacific Coast Hwy, Suite 1100, El Segundo, CA 90245
  • |
  • Contact Us:
  • 83-EXTENSIV 888.375.2368 (main)
  • |
  • 310.844.7570 (local)
  • Copyright © 2023 Extensiv
  • |
  • All rights reserved.
  • Privacy Policy
  • |
  • Terms of Service
  • Follow Us:
Expand