Analytics - SKU Profitability
What does this report reveal?
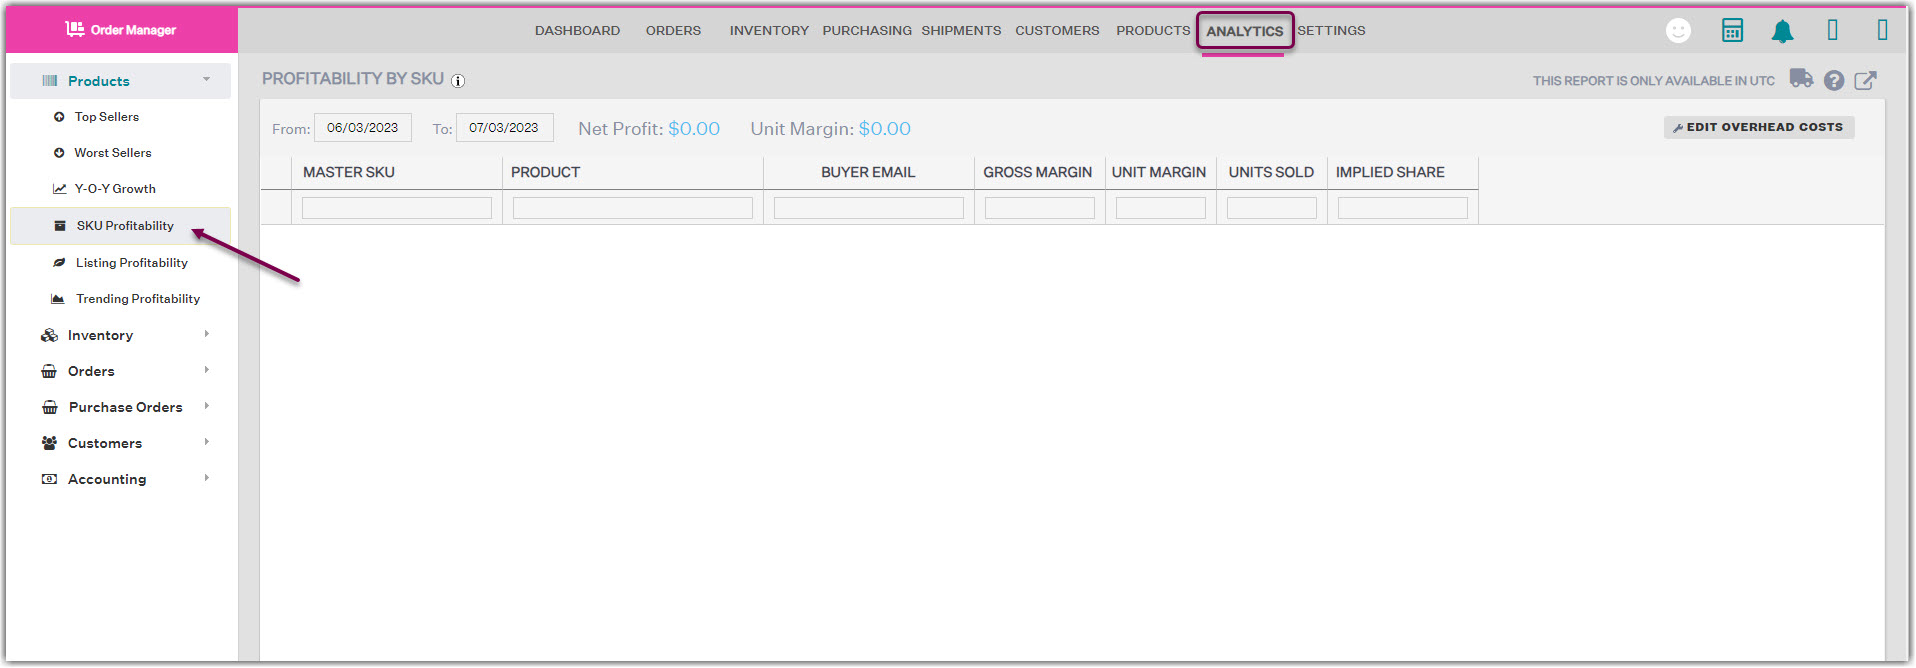
This report reveals the holy grail of e-commerce data – how much true profit each product makes. After Extensiv Order Manager pulls all of your fee data and after you input your overhead costs, this report reveals your exact gross and unit margins per SKU to an incredibly accurate estimate.

How to read this report?
This report organizes your individual SKUs by their profit margins and implied shares. Click into each SKU to get surgical and analyze how well each SKU performs for each sales channel. The implied share gauges how much the SKU contributes to the overall profit margins of your business. Anything above 0 is a positive influence, and anything below is negative.
What actions to take after analyzing this report?
After your analysis, use your given data to identify where each SKU under-performs per channel. Watch your implied shares to ensure each SKU is performing well – if not, you’ll either have to liquidate or optimize your specific listings. Bring your products above 0 implied share to bring in profitable revenue. Identify what’s weighing you down and decide on the course of action.
How to export this report
This report is exportable in Microsoft Excel format. For instructions, see Exporting Reports.
